Web Activity: Distribution of the P-values Under the Null Hypothesis of a One-Sample Z-test
(0)Explore the distribution of the P-values when the null hypothesis of a one-sample z-test is true.
Prerequisite Knowledge
- Be able to plot a histogram, either by hand or using a computer software.
- Know that a one-sample, two-sided z-test uses a random sample to determine whether the population mean is different from a specified value.
- Understand the terms significance level and Type I error in the context of a z-test, as well as their relationship with Type II errors.
- Be able to compute P-values of a z-test and explain how to use them to reject (or fail to reject) the null hypothesis at a given significance level.
- Be familiar with the Normal distribution and its two parameters, the mean and standard deviation, as well as the Uniform distribution in the interval [0, 1].
Learning Objectives
- Identify the probability distribution of the P-value of a one-sample, two-sided z-test when the null hypothesis is true.
- Explain in simple terms why a P-value follows a particular distribution under the null hypothesis.
- Recognize that the P-value of a hypothesis test is a random variable.
Description
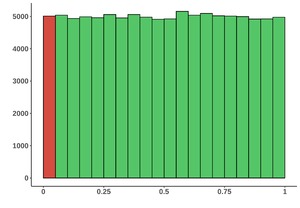
The goal of the activity is for students to develop an intuition about the distribution of the P-value under the null hypothesis of a two-sided, one-sample z-test. The first part of the activity is a recap of hypothesis testing and z-tests in particular. The students then explore how P-values change when multiple settings of a z-test (such as the sample size) change. The third part of the activity prompts students to generate multiple P-values using an interactive resource and plot their histogram. During the final part of the activity, students use another interactive resource to generate thousands of P-values and relate their distribution with the significance level and the probability of a Type I error.
Suggested Uses, Tips and Discoveries
This activity can be used to further the students’ knowledge and understanding of P-values, using the context of a one-sample, two-sided z-test. The basic concepts, as outlined in the prerequisites section, should already have been reviewed in class, and students should feel comfortable with them. If this is not the case, the activity linked in the related resources tab can be used as a pre-activity.
The activity takes about 30 minutes and is appropriate for all class sizes and formats. It can be implemented in multiple ways—as an in-class activity, in a lab, as a homework assignment, amongst others. For the third part of the activity, if students are familiar with computer software for histogram plotting, it is recommended that the activity be implemented in a setting where students can use that software (such as a lab).
Related Resources
Understanding Type I Errors, Type II Errors, and P-values
Learn how to calculate P-values for a one-sample z-test, how to detect Type I and Type II errors in real-life settings, and the relationship between the significance level and Type I errors.
Creator
- Di-Luvi, Gian Carlo
Resource Type
Related Resource
Date Approved
Access
Everyone
https://statspace.elearning.ubc.ca/handle/123456789/400

Comments
Ratings in detail