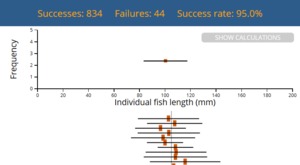
Confidence intervals for the mean
(0)This web visualization shows the meaning of a confidence interval, calculating confidence intervals of the means of repeated samples.
Prerequisite Knowledge
- Familiarity with methods of summarizing data sets, such as mean and standard deviation
- The ability to identify and distinguish between a population and a sample, and between parameters and statistics
Learning Objectives
- Interpret a confidence interval and confidence level
- Identify features that determine the width of a confidence interval
Description
Code: https://www.zoology.ubc.ca/~whitlock/Kingfisher/
Funding: University of British Columbia
Project Leader: Mike Whitlock
Programmers: Boris Dalstein, Mike Whitlock & Zahraa Almasslawi
Art: Derek Tan
Translation: Rémi Matthey-Doret
Testing: Melissa Lee, Gaitri Yapa & Bruce Dunham
Thanks to: Darren Irwin, Dolph Schluter, Nancy Heckman, Kaylee Byers, Brandon Doty, Kim Gilbert, Sally Otto, Wilson Whitlock, Jeff Whitlock, Jeremy Draghi, Karon MacLean, Fred Cutler, Diana Whistler, Andrew Owen, Mike Marin, Leslie Burkholder, Eugenia Yu, Doug Bonn, Michael Scott, the UBC Physics Learning Group & the UBC Flex Stats initiative for numerous suggestions and improvements.
Suggested Uses, Tips and Discoveries
These web visualizations are intended to be used in a number of ways:
- as a visual aid during lectures;
- as an open-ended learning tool for active learning;
- as a guided learning experience, using either the built-in tutorials, guided activity sheet, or other instructor-supplied material.
We learned a lot about this resource from trialling with students. Students often have trouble interpreting confidence intervals and hold some common misconception. For instance, many students believe, for the same data and parameter of interest, a 90% confidence interval is wider than a 95% confidence interval. Read more.
Related Resources
Sampling from a Normal Distribution
This web visualization demonstrates the concept of a sampling distribution of an estimate, using the example of a mean of a Normally distributed variable. It also reinforces the idea of a histogram.
Creator
- Whitlock, Michael
Resource Type
Related Resource
Date Approved
Access
Everyone


https://statspace.elearning.ubc.ca/handle/123456789/75
Comments
Ratings in detail